Previous topicNext topic

Help > ArtisanACAD_xx.1.44.0 Planting > Planting Schedules > Report Settings >

Artisan Landscape for AutoCAD & BricsCAD

Editing Report Templates

Purpose

Edit a particular local report template

Usage

Local Report Templates editing is accessed from the Local Report Templates tab of the Preferences dialog.


Layout

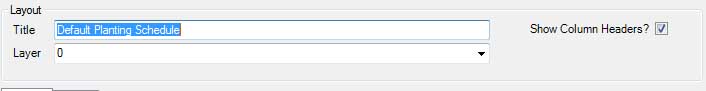
The layout section of the dialog affects certain overall features of the report.

Title - The default title used when placing the report. This can be overriden when placing the report. See the Insert Report command.

Layer - The CAD system layer that the report is placed on.

Show Column Headers - If ticked the report will have headers for each field (column).


Data

The Data tab affects the data selections and display with the report

Data Grouping

If records are added in the data grouping section any report based on this template will be sub divided according to the values in the data grouping records.

Order - The Order of the grouping is only relevant if the report has at least two grouping fields. In that case the sub reports will be ordered by the values of the fields in the grouping fields ranked by this Order value.

For example if grouping by Class (Order 1) and Subclass (Order 2) then Shrubs - Roses will be beforeTrees - Conifer but if grouping by Subclass (Order 1) and Class (Order 2) then Conifer - Trees will be before Roses - Shrubs.

Field - The source field for the values the report will be grouped on. In the above example the report is being grouped by Class. This will result in a seperate sub report for Trees, Shrubs etc.

Data Fields

These are the columns that will appear in the report. At least one column is required.

Order - The order left to right of the columns

Field - The source field for the data in the column.

Header Text - The column heading (only if Show Column Headers is ticked in the Layout section)

Width  - The column width. This is the printing width based on the Scale entered in the Layout section. So if 0.1 is entered and the scale is 1:100 then the column will actually draw at 0.01 x 100 = 1 wide. Then printing out at 1:100 the printed width will be 0.1

Show Total - If ticked the column will have a total calculated and displayed.

Data Filters

These are the values that data is checked against to determine if labels are included in the report.

Note that, by default ALL Artisan Labels will be included in a report: for this reason, the Data Filter <Category Equals Planting> will only display records where the category equals planting (i.e. non-planting is excluded).

Field - The source field for the comparison values that will be used for filtering.

Filter Type - The type of comparison used. The possible Filter Types are:

  1. Equals - data is only included if the value equals the filter condition.
  2. Begins With - data is only included if the value begins with the filter condition.
  3. Contains - data is only included if the value contains the filter condition.

Condition - The filter condition that the field value is compared with.


Format

The format tab affects the visual appearance of the report.

General

Scale - The overall scale of the report. The report will be drawn in CAD according to the various sizes specified in this report dialog multiplied by the scale. Therefore if working in model space enter the scale that the drawing will be eventually printed out at and then the report will appear on paper the according to the column and text sizes entered.

Total Double Line Seperation - The total lines, if used, will be seperated from the main data line by a double line. This setting controls the seperation width of this double line.

Border Lines, Section Lines, Data Lines

These sections control the appearance of the lines drawn within and around the report. Border lines are the outside boundary, section lines the line between each sub titled section of the report, data lines are all the other lines.

Colour - The colour of the line.

Lineweight - The thickness or weight of the line.

Linetype - The CAD linetype or style of the line.

Note: The actual appearance in CAD will also depend on the CAD settings, such as layer settings.

Title Cells, Subtitle Cells, Column Header Cells, Data Cells

These sections control the appearance of the text and fill with the cells and also the cell height. The title cell is the top row of the report containing the title. The Subtitle cells are the rows containing sub titles or section headings. The Column Header Cells are the cells containing the titles of the various columns within the report. The Data cells are all the other cells, including totals.

Text Style - The style of the text used in the cell.

Text Height - The height of the text used in the cell.

Padding - The gap between the text and the cell edge / boundary.

Text Colour - The colour of the text.

Fill Colour - The colour of the space or background within the cells.


Colours

Next to each colour definition is the above symbol. Clicking on this symbol will display the Windows Colour Selector dialog. Use this dialog to select the colour that the various sections of the report will use. Either a built in Windows colour (which may also be a built in CAD colour) or a custom defined colour may be used.

Custom defined colours with a very light shade are often best for Fill Colour usage. Custom colours will be displayed on the main report dialog with both a preview colour square and also an RGB (Red, Green, Blue) definition. This allows the definition to be noted and then manually entered into either the Windows Colour Selector or other applications to reproduce the colour.


Display of a custom colour within the report template editor. Note the RGB values (Red = 202, Green = 230, Blue = 203). The colour square shows a preview of the colour (light green). Default view of the Windows Colour Selector Dialog. Note the button "Define Custom Colors". Click this to define a custom colour (such as the light green shown opposite). View of the Windows Colour Selector Dialog after "Define
Custom Colors" has been clicked.

The hightlighted area shows where the RGB information
should be enteted to duplicate an existing colour.


File

The file menu allows the edited report to be saved.

Save - Save the report to its source. If the edit has been initiated from the preference file then the report will be saved back to the preference file. If the edit has been initiated from an existing report then the existing report will be edited.

Save to File - Save the report to an Xml file. The file can then be used in another drawing, on another machine as needed.

Close - Close the edited report without saving.

Links

Insert Report